

_edited.png)
Is There Any Truth in the Wolf of Wall Street? Microcaps Yield a Higher Return Compared to S&P 500?
- Mar 27, 2021
- 8 min read
Updated: Oct 30, 2021
SPDR S&P 500 (SPY) vs. iShares Microcap ETF (IWC)
Summary:
Returns of Microcaps vs. large caps should, theoretically, be different. This is not backed by data, however.
Data reveals the returns of Microcaps vs S&P 500 don't exhibit any difference.
The risk profile of Microcaps vs S&P 500 is analyzed, and is not identical.
Strategy to profit from Microcaps is elaborated.
© RISK CONCERN. All rights reserved.
If you recall, there is a part in the film, the Wolf of Wall Street, where a few clients of the infamous Jordan Belfort, are shown to have actually made money. In the Movie, Belfort, an unscrupulous broker, sells penny stocks to his clients, employing deception and whatnot to make money.
But are penny stocks junk? Or is there any merit in investing in penny stocks? If one buys a Microcaps ETF, such as iShares Microcaps ETF, surely with a diversified ETF and high growth prospects of Microcaps, the thought of returns higher than the S&P 500 does not seem illogical.
Is there some veracity in the wolf of Wallstreet, hence?
Previously, in our analysis of the Midcaps vs. Large caps, and Midcaps vs Nasdaq, we found no statistical significance in one having a higher return or variance compared to the other (see: Nasdaq vs. Russell 2000: Is There More Money in Small-Caps Compared to Nasdaq or Nasdaq 100 Index? Linked below). The assumption stated in that report, however, is as follows:
"The conventional viewpoint would say that the small firms should not be as profitable compared to the larger established players? Why? This is because the big guys should be able to achieve economies of scale and gain value through synergistic ventures that provide them a competitive advantage compared to the smaller guys. The bigger players, arguably, also have better access to capital and capital markets.
What advantages do the smaller guys have, comparatively?
Arguably, the smaller guys, most vitally, should, theoretically, be more 'agile,' and because of this, better able to navigate the volatile, uncertain, and ambiguous (VUCA) business environment. For example, in a dynamic environment, with unanticipated changes constantly impacting business decision-making, the smaller firms, being less bureaucratic, with teams better integrated with the resilient but less obstructive and fluid organizational structure, should be able to react more rapidly and proactively, compared to larger firms with multiple complex entanglements that have to be cautiously weighed before making and implementing business decisions.
Furthermore, arguably, smaller firms are also newly created firms (less than five years old, for example) with novel creative approaches and products. They make an effort to do things differently.
Thus, we can consider two theoretical forces for large firms and small firms:
1. Large firms – the advantages that the larger firms have, due to economies of scale and value gained through synergistic ventures. Also, easier access to capital.
2. smaller firms – the advantages of agility, novel approaches and products, creativity and ability to react more rapidly due to less complex business entanglements.
The force more overpowering, thematically, should generate a higher return for investors; for example, if force 1. supersedes force 2., investment in the larger firms should be more profitable for investors, or vice versa. There is also the issue of risk profiles. Arguably, smaller firms should be riskier investments (source)."

This was not established by the analysis of the data, nonetheless. But, perhaps, there is a difference between Microcaps and Large caps. To analyze this question, we assessed iShares Microcaps ETF vs S&P 500. iShares Microcaps ETF has over 1200 holdings of companies with a market cap between $50 million to $300. The assumption of the returns of S&P 500 and iShares Microcaps ETF not being equal seems very likely, but what does the data tell us?
The Returns?
The analysis reveals that the monthly mean return for S&P 500, for the last 15 years, with a 98% confidence interval, stands at 0.72% ± 0.743470%; the monthly mean return for iShares Microcaps ETF, for the last 15 years, with a 98% confidence interval, stands at 0.744% ± 1.07330%.
Jump to key takeaways So, a very slight edge for iShares Microcaps ETF?
We must conduct hypothesis testing for definitive answers:
Paired comparison test has been conducted to evaluate statistical significance, as both the Microcaps and the Large caps rely on one primary economy, fundamentally.
H0: μd - μ0 = 0 versus Ha: μd - μ0≠ 0.
, where
μd – the difference of the returns of the two tested indices.
μ0 – 0
Paired sample T-test, using T distribution (df=184) (two-tailed) (validation) 1. H0 hypothesis Since p-value > α, H0 cannot be rejected. The average of Microcaps-S&P 500's population is assumed to be equal to the μ0. In other words, the difference between the average of Microcaps-S&P 500 and the μ0 is not big enough to be statistically significant. 2. P-value The p-value equals 0.9038, ( p(x≤T) = 0.5481 ). It means that the chance of type I error, rejecting a correct H0, is too high: 0.9038 (90.38%). The larger the p-value the more it supports H0. 3. The statistics The test statistic T equals 0.121, which is in the 98% region of acceptance: [-2.3468 : 2.3468]. x=0.0003, is in the 98% region of acceptance: [-0.005818 : 0.005818]. The standard deviation of the difference, S' equals 0.00248, is used to calculate the statistic. 4. Effect size The observed effect size d is small, 0.0089. This indicates that the magnitude of the difference between the average and μ0 is small.
The null will hold if the difference in the mean returns of the tested equals 0.
The null holds, therefore.
We can state with confidence, as per the results, that the returns of iShares Microcaps ETF and S&P 500 are similar, and there is no statistically significant difference between the returns of the two.
So, what does this mean, simplistically?
If you believe that investing in Microcaps will, over time, yield you a higher capital gain, then that assumption is incorrect. There is no evidence backing that assumption, and as far as returns are concerned, you should be indifferent. One is not better than the other.
The fundamental reason here is that they both rely on the same economy, and the data suggest that small caps don't perform better or worse when the overall economy is doing well, or the large caps don't have an advantage (assuming an efficient market)
What about the risk of iShares Microcaps ETF compared to the S&P 500? It should be the same as well, if the returns are the same, correct?
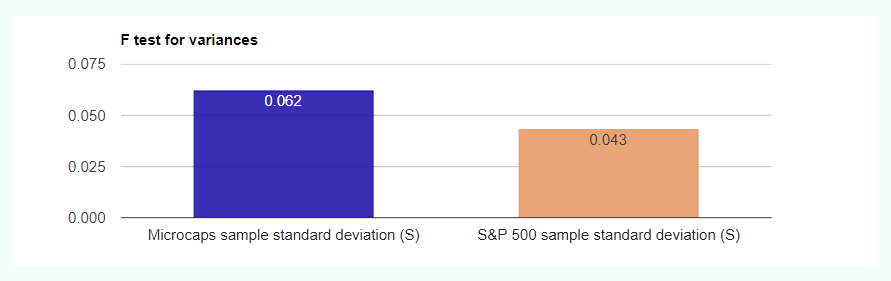
To analyze the risk, we must conduct a F test. The F test is conducted as:
H0: σ2MC = σ2S&P500 versus Ha: σ2MC ≠ σ2S&P500,
, where
σ2MC – the variance of the returns of iShares Microcaps; and,
σ2S&P500 – the variance of the returns of S&P 500.
The F Test reveals:
F test for variances, using F distribution (dfnum=184,dfdenom=184) (two-tailed) (validation) 1. H0 hypothesis Since p-value < α, H0 is rejected. The sample standard deviation (S) of Microcaps' population is considered to be not equal to the sample standard deviation (S) of S&P 500's population. In other words, the difference between the sample standard deviation (S) of the Microcaps and S&P 500 populations is big enough to be statistically significant. 2. P-value The p-value equals 8.673e-7, ( p(x≤F) = 1 ). It means that the chance of type I error (rejecting a correct H0) is small: 8.673e-7 (0.000087%). The smaller the p-value the more it supports H1. 3. The statistics The test statistic F equals 2.0841, which is not in the 98% region of acceptance: [0.7087 : 1.411]. S1/S2=1.44, is not in the 98% region of acceptance: [0.8418 : 1.1879]. The 98% confidence interval of σ12/σ22 is: [1.477 , 2.9407].
F test for variances, using F distribution (dfnum=184,dfdenom=184) (left-tailed) (validation) 1. H0 hypothesis Since p-value > α, H0 is accepted. The sample standard deviation (S) of Microcaps' population is considered to be greater than or equal to the sample standard deviation (S) of S&P 500's population. 2. P-value The p-value equals 1, ( p(x≤F) = 1 ). It means that the chance of type I error, rejecting a correct H0, is too high: 1 (100%). The larger the p-value the more it supports H0. 3. The statistics The test statistic F equals 2.0841, which is in the 98% region of acceptance: [0.738 : ∞]. S1/S2=1.44, is in the 98% region of acceptance: [0.8591 : ∞]. The 98% confidence interval of σ12/σ22 is: [0 , 2.824].
What does this mean, simplistically?
The variance of Microcaps compared to S&P500 is not the same; the Microcaps are riskier. This presents a possible paradox: with a higher risk, the returns of the Microcaps should, theoretically, be higher, to compensate for the higher risk, assuming an efficient market. This, however, is not the case as both have similar returns but different variance; this condition, in and of itself, is telling:
A security that has a higher variance attached to it requires a higher risk premium for investors to be interested in it, and for the condition of no-arbitrage to hold. The long-term risk of Microcaps is higher than S&P 500, but the capital returns are similar; this condition, of course, should not persist long-term, as either the returns of Microcaps should reduce, with investors observing the higher variance and discounting the future potential capital growth with a higher discount rate. Alternatively, the returns of Microcaps increase, for risk parity to hold. The former seems more likely than the latter.
There is a further complexity, nonetheless. With the market cap of firms considered Microcap stipulated to be between $50 million to $50 million, the returns profile of any ETF based on the Microcaps should represent a particular spectrum of firms: 1. Those that are past the embryonic stage of their development but in the introduction stage, 2. Those stuck in the Microcap spectrum due to lack of substantial growth (stagnation), and 3. those that experienced a decline in market capitalization, from what's considered Midcap. In either of the three cases, however, the conventional viewpoint states that the times should be turbulent for the firm included in the Microcaps ETF.
The nature of Microcaps, thus arguably, introduces a higher level of risk. This higher variance has not resulted in a higher return due to the distribution of Microcap indices, such as the Russell Microcaps index and the iShare Microcaps ETF including firms, as elaborated above, in a variety of stages: introduction stage (this is beyond the embryonic stage), the stagnations stage or maturity stage in the Microcaps, and in a decline, from the Midcap market cap.
But not firms that are in the introduction to growth stage only.
Thus, the nature of the full-spectrum of Microcaps implants a higher level of risk. In conclusion, an intelligent investor interested in high-growth Microcaps, is more likely to generate a higher return by allocating positions to individual companies based on the companies' fundamentals and risk-related idiosyncrasies.
By using this, more time-consuming and meticulous method, she should be able to eliminate those Microcap names that are in decline from the Midcap range and hence in the Microcaps range due to firm-related issues, and also those that are stagnating in the Microcaps range. Alternatively, she can also buy a Microcaps ETF, and then eliminate the companies that she does not want exposure to, due to the aforementioned causes.
To do so, she would have to sell the shares of the companies included in her ETF, at an equivalent level of the exposure to these companies. For example, if her ETF position contains 10 shares of GameStop (GME), she can eliminate this exposure by separately selling 10 GameStop shares.
Nevertheless, the individual stock weight (allocation) in an index can continually readjust and change; using this second method should be very demanding. She would also incur a double brokerage fee. Therefore, the first method of allocating positions to individual companies, based on the companies' fundamentals and risk-related idiosyncrasies, seems more logical. If this is not possible, then the alternate solution is to hold positions in the S&P 500 or Wilshire 5000 only.
For risk-adjusted returns of top global indices, i.e., returns offered per unit risk & other diversification concerns, see our report: Which stock indices/index-based ETFs provide the best risk-adjusted returns
Excel Data:
Keywords: microcaps in-depth analysis, microcaps etf comparison with S&P 500, ishare microcaps etf vs SPDR S&P 500 ETF SPY, microcaps vs s&p 500, are microcaps better than S&P 500, microcaps strategy, russell microcaps analysis, microcaps investing strategy, ishare microcaps etf any good, microcaps returns, microcaps variance compared to S&P 500.

Comments